Class Log
- 4-20-2021
- 4-14-2021
- 4-6-2021
- 3-30-2021
- 3-23-2021
- 3-16-2021
- 3-9-2021
- 3-2-2021
- 2-23-2021
- 2-16-2021
- 2-9-2021
- 2-2-2021
- 1-26-2021
- 1-19-2021
- 1-13-2021
4-20-2021
Demystifying time series packages like FB Prophet
They just feature engineer for you! The easy feature engineering is extracting features from the date. Harder is rolling windows on the target. Thought exercise: How might you engineer those features on your own?
HTTP status codes
2xx, 3xx, 4xx, 5xx. Just read this
Using them for handling responses from web api requests (for example, python requests.codes.ok, or just r.raise_for_status() beloved feature).
LaTeX is not a format!
IEEE is a format. There are LaTeX templates, and also Word templates. If you insist on using LaTeX, consider using a latex wsyiwyg like overleaf.
GCP deploy
We looked at deploying an sklearn model to GCP.
4-14-2021
We deployed a model to heroku. Talked about web app development in general.
4-6-2021
Guest speaker: Daniel Kowalewski. Topic: The pains of data center replication and redundancy. Stories from CU and Percona.
Q&A on unit testing ML scripts
Video recording on making a simple flask app that can receive and return JSON
3-30-2021
Guest Speaker: Junji Wiener
DiSH Data Analyst
Time series analysis to predict how many call center reps will be needed on any given day. FB Prophet. Local jupyter notebooks on a fileserver. Looking to move to AWS.
A/B Testing / User Experience testing
- Cornell study
Interacting with databases with python
“have you ever used python to interact with a database before?”
- Pandas has a read_sql function
- SQLAlchemy – abstracts away from the specific db engine
3-23-2021
Guest Speaker: Patrick of DeepWatch
- Splunk, applies unstructured machine learning to netflows. Even has sklearn
functions called from within! (
StandardScaler(),DBSCAN(eps=2)).
Virtual environments
- More practice with virtual environments
- Wherefore Docker? virtual environments beyond just python packages
3-16-2021
We tried, and failed, to learn P4 programming in 30 minutes.
A horror story from debugging the psiTurk error message about init unexpected argument.
Helping get wsl for windows users.
3-9-2021
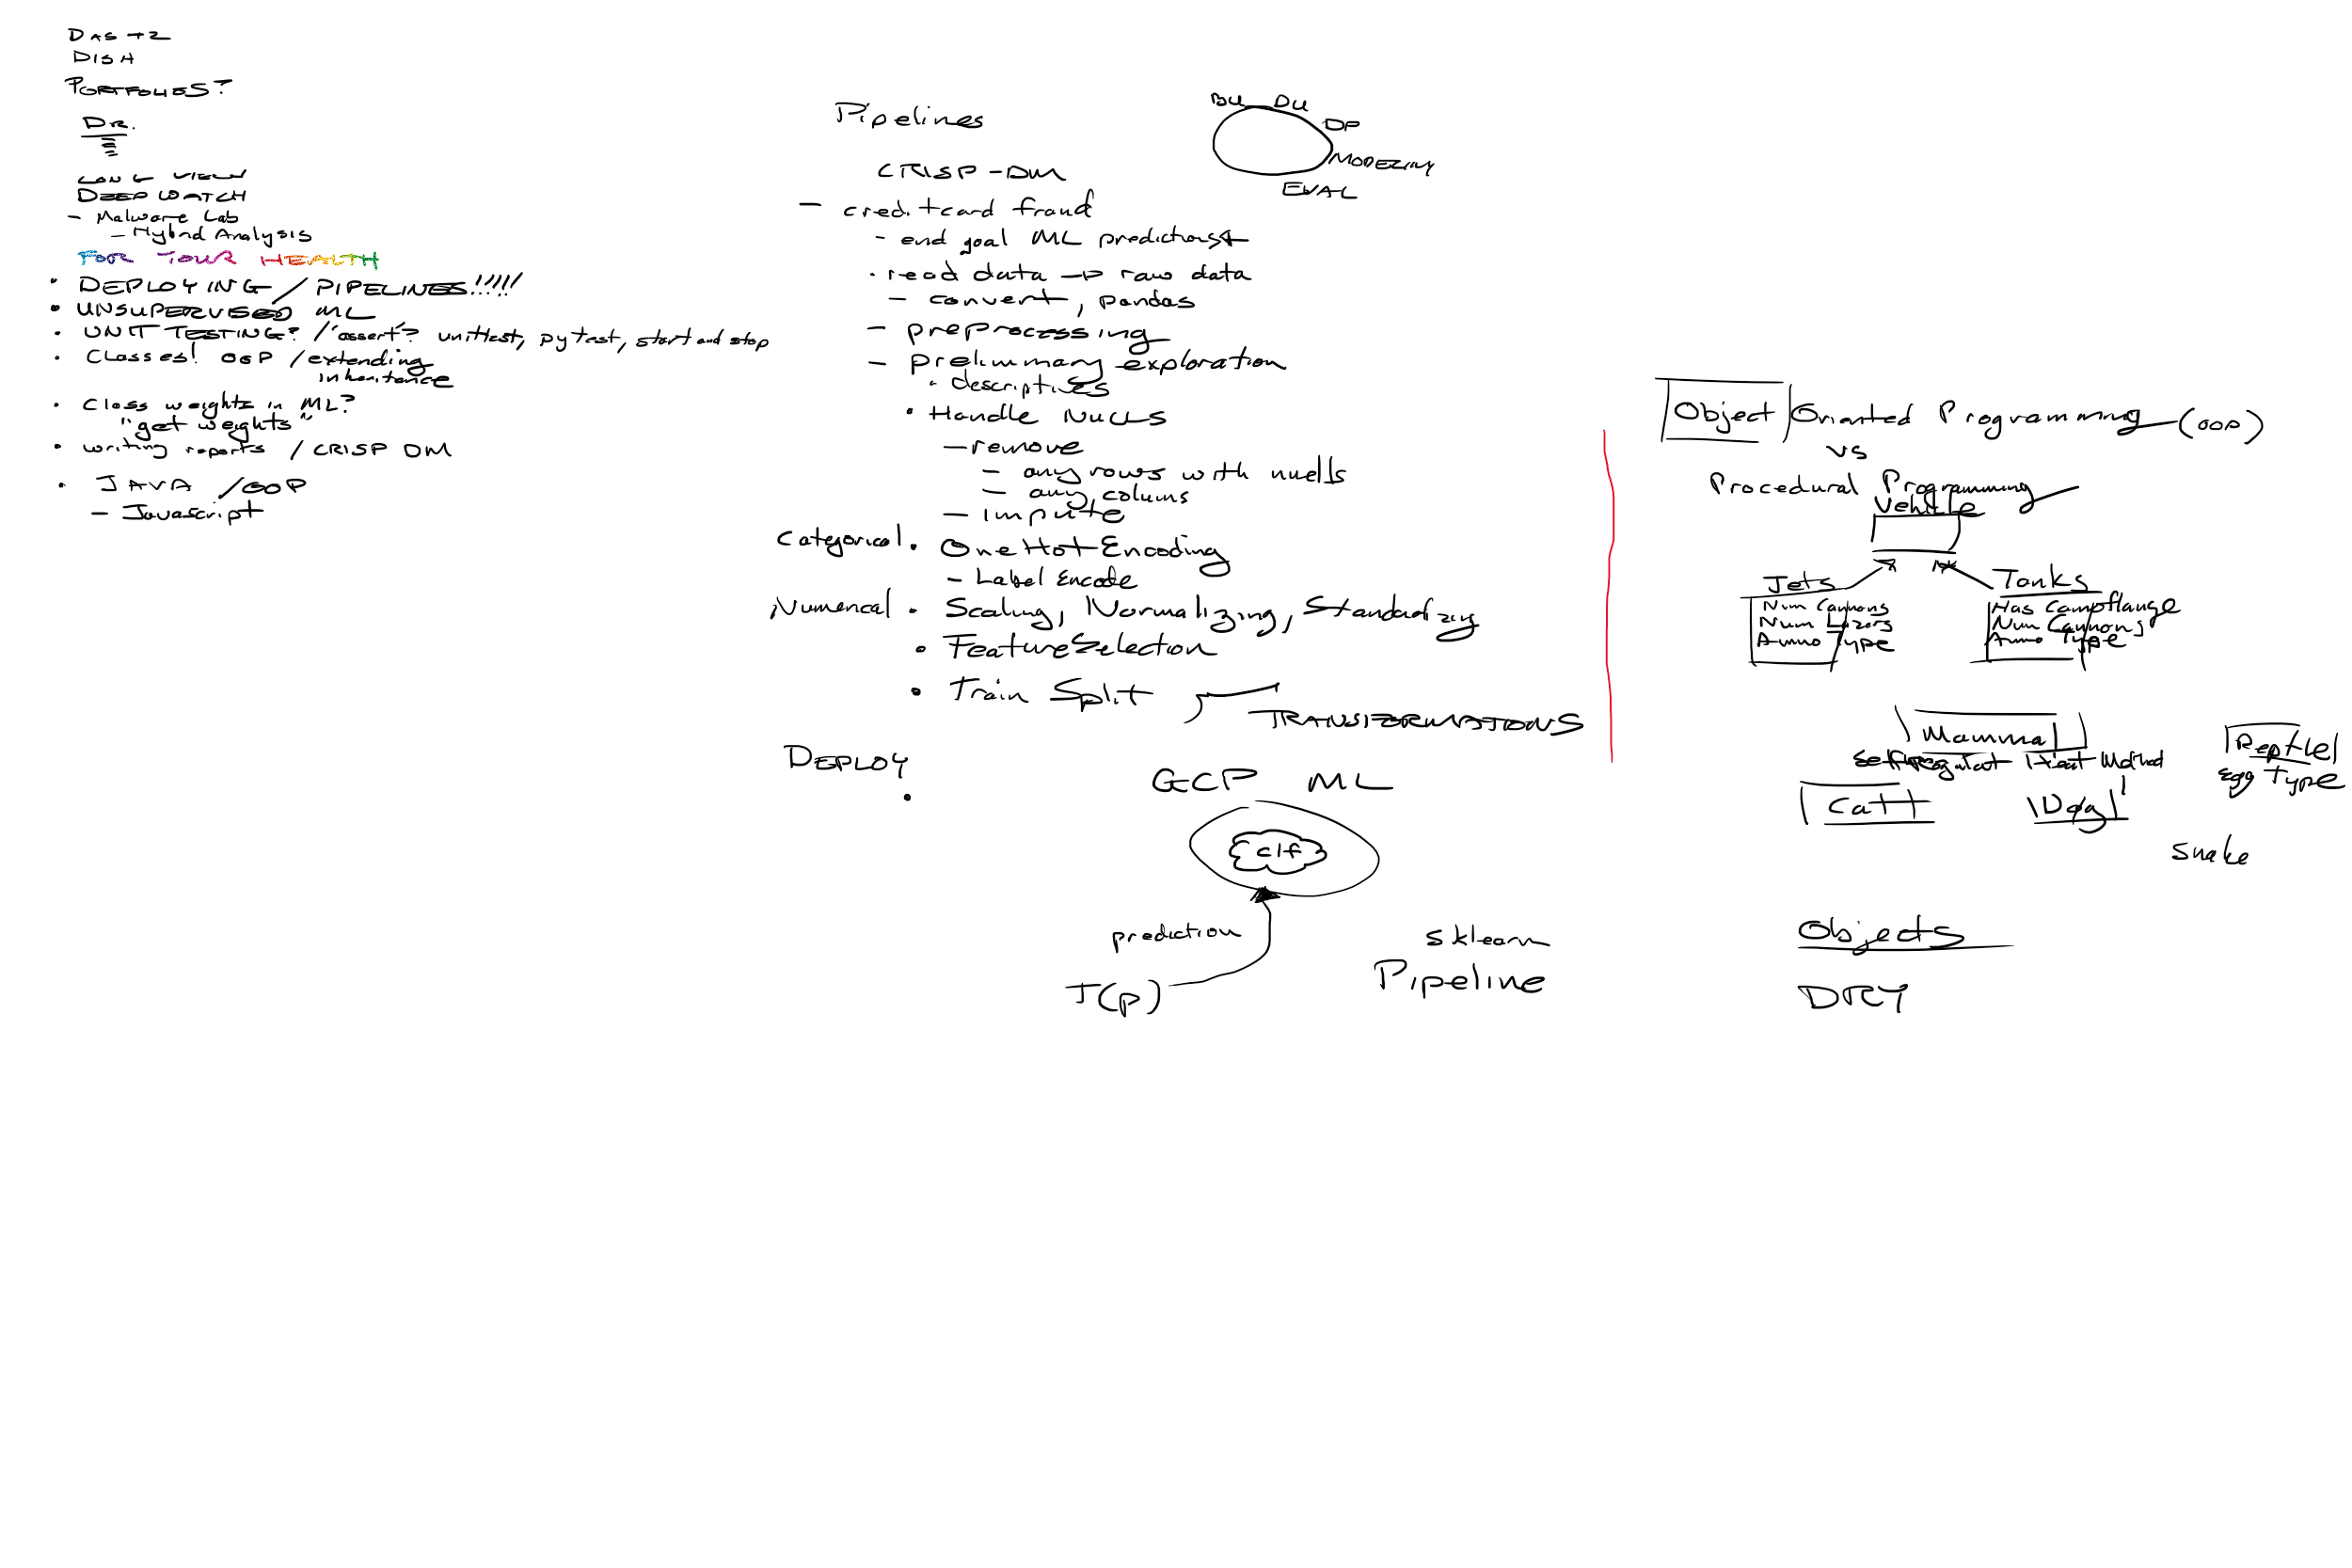
Pipelines and Deploying
We talked about the pain of needing to reapply transformations to any data for which a prediction is desired. Sklearn pipelines are a way to encapsulate all transforms into a single object alongside a final classifier. We read the sklearn pipeline documentation page and also the example demonstrating data with mixed columntypes.
Following a coding interview question that some students received, we also talked about classes in python, demonstrating with an example we came up with of Animals and Dogs, which I promise we totally didn’t realize was just a little bit lower in the official python docs for classes. But we practiced learning things from carefully reading the docs. I made an aside reference to “information scent” to help us find valuable content in the docs by reading the table of contents.
Students in CYBR network security analytics have been asked to write some kind of unit testing for their projects. We discussed how that might be done. I pointed to psiturk and kepler-mapper, two projects with which I have been involved, to demonstrate in the first instance, mocking API calls and ensuring a fresh environment for each call, and for the second instance, an example of breaking out logic into modular function chunks – private class methods – to make unit testing them easier. We mentioned two approaches to unit testing – one with a “write the test first, then write code to make the test pass” approach, and another with “write a test that demonstrates the bug, then fix the code until the test passes” approach.
3-2-2021
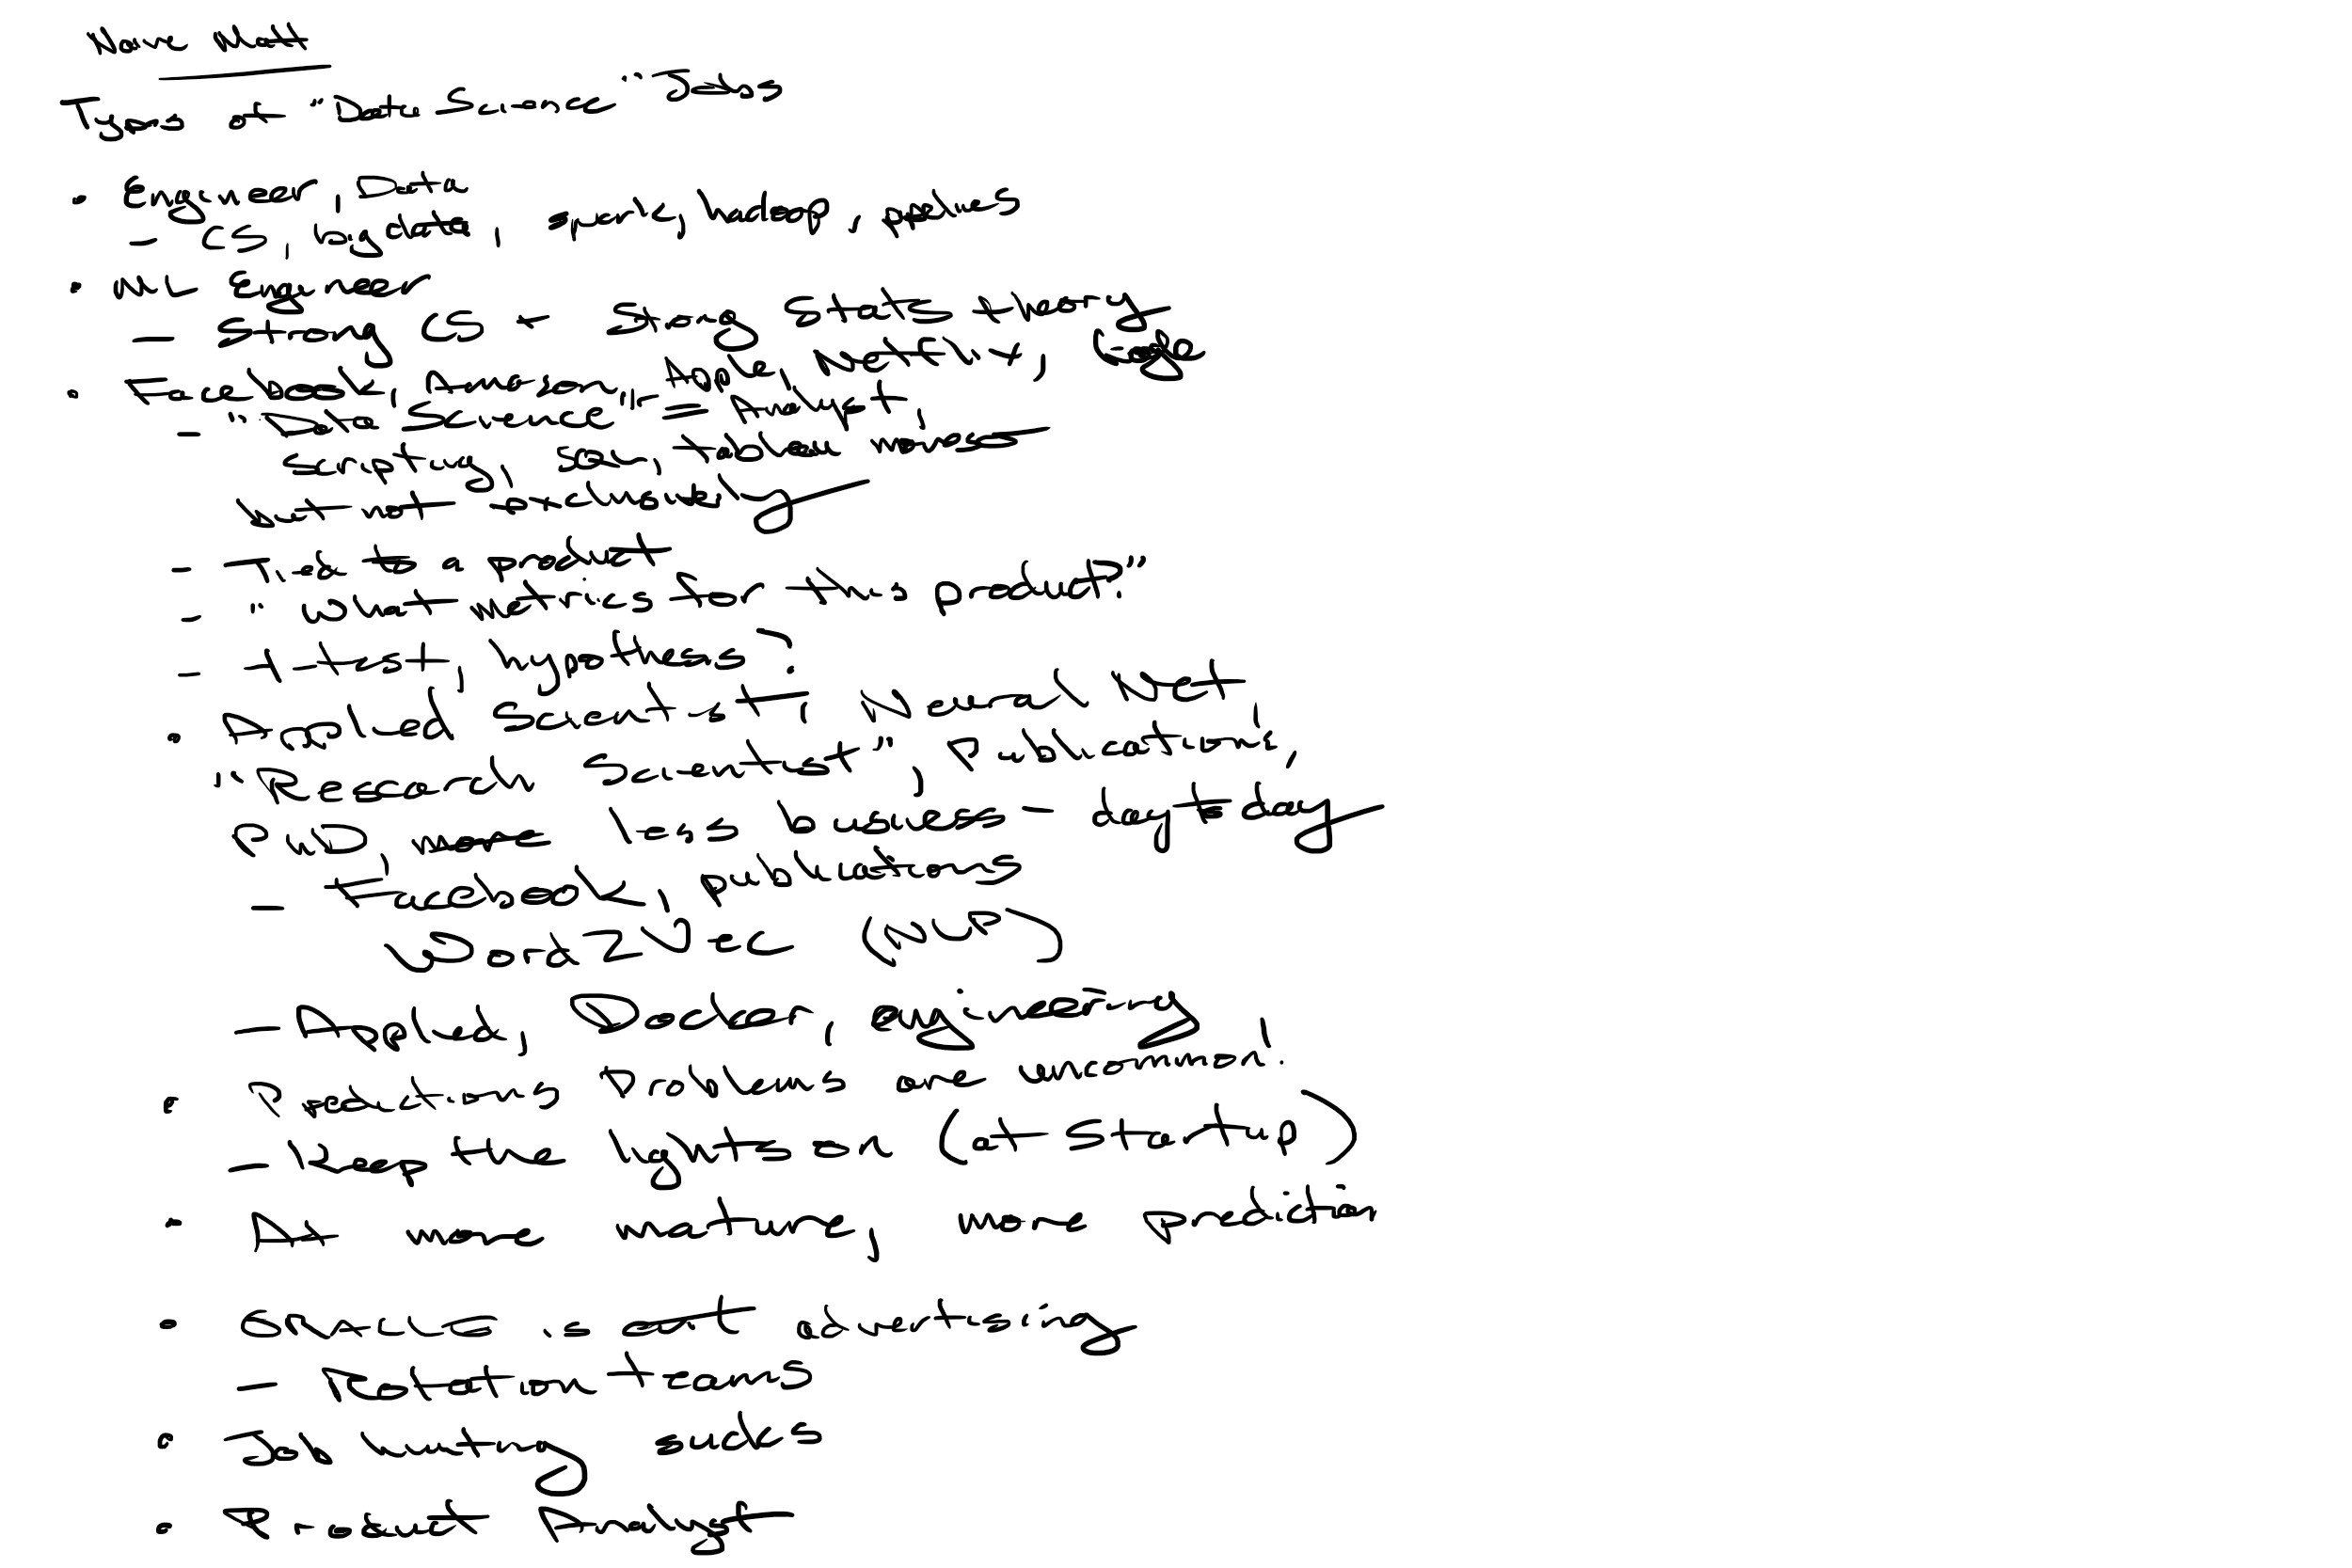
My good friend Matt Goodwin, data scientist, treated us with a guest talk / interview. He talked about his time at the medical startup Castell in Utah, and also his time in Broomfield in Oracle Data Cloud (ODC).
After his visit, we played with some python examples demonstrating looping in
python. We started from horrible you-should-use-a-loop-for-that code inspired
by things I’ve seen on /r/programmerhumor,
then we showed the not-python
for (var i, i++, i < len(list)). This led to a tangent about a recent news article
lambasting GTA V for some cloud launch logic that was causing the boot times to take
7 minutes instead of the code-optimized 2. Specifically, not caching a list len check,
and also, inefficient checking for duplicates. We finished with python’s for x in y
syntax, and we also peeked at list comprehensions. A student provided a jupyter notebook
(blank version), (completed version), (completed version with lecture scratch),
with some queries we riffed off of for live demonstration purposes.
2-23-2021
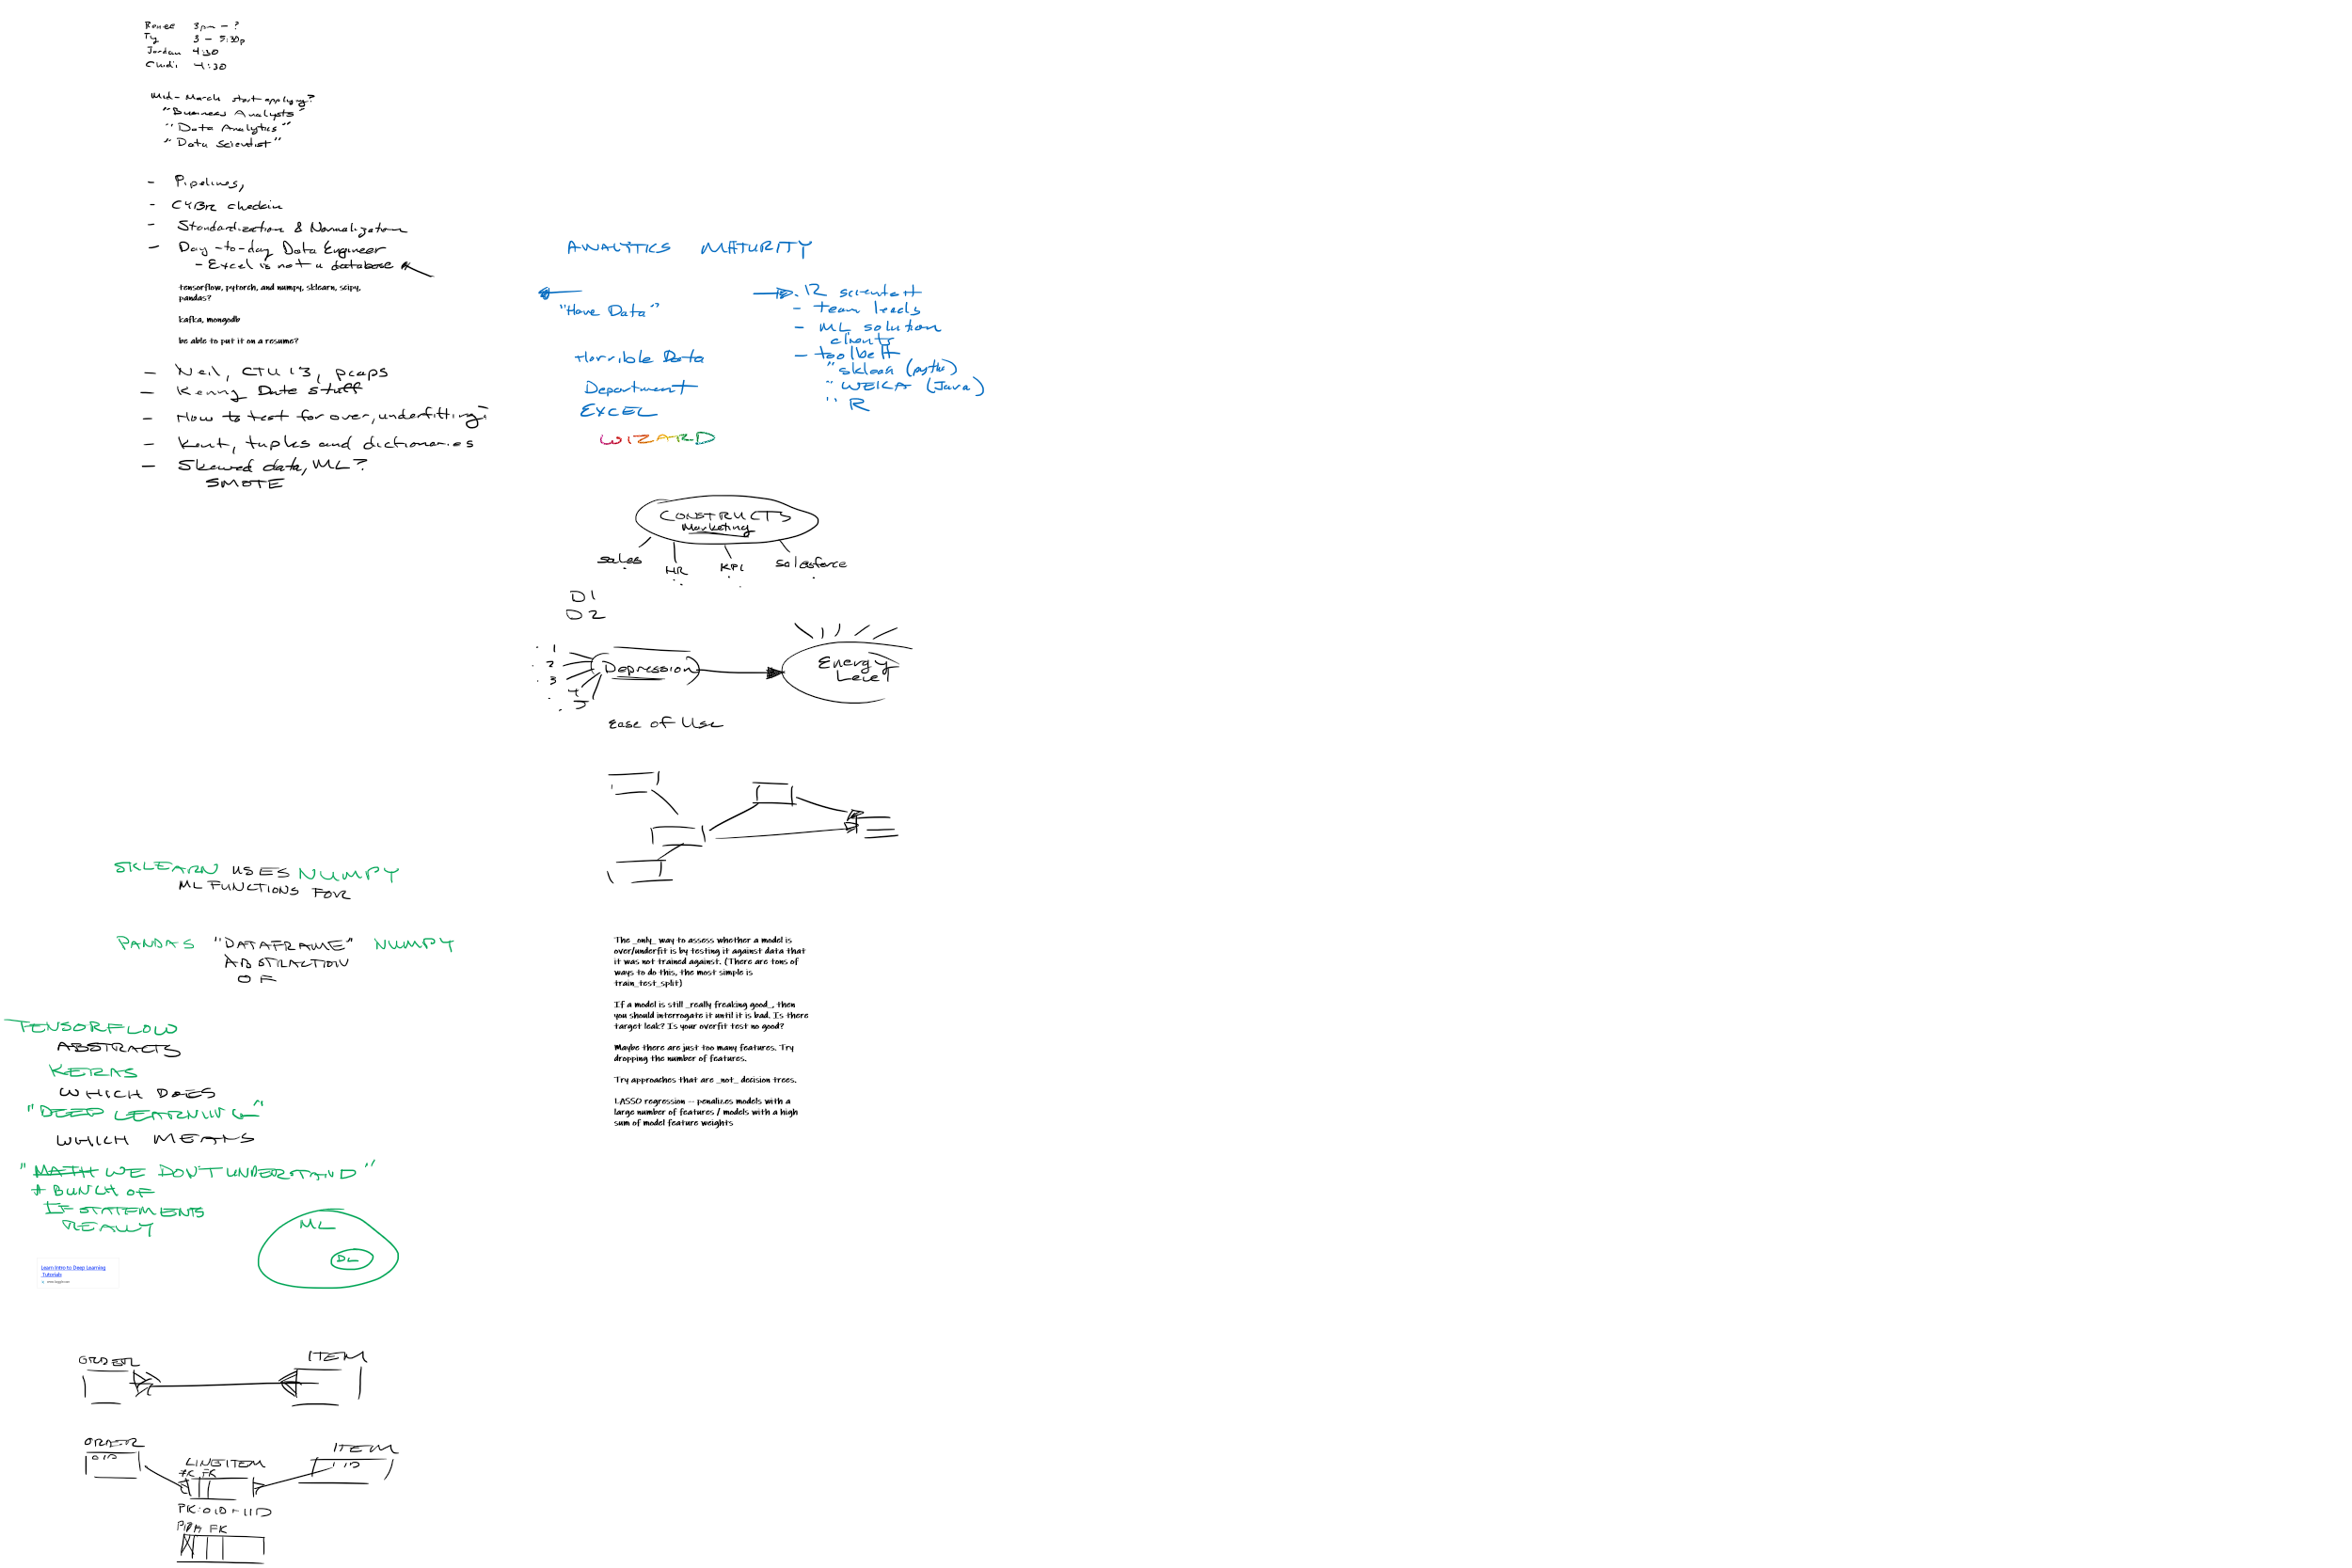
- A brief discussion on how the “day to day” life of a data scientist totally depends on the analytics-maturity of the company for which the data scientist works
How to test for over- or under-fitting?
The only way to assess whether a model is over/underfit is by testing it against data that it was not trained against. (There are tons of ways to do this, the most simple is train_test_split)
If a model is still really freaking good, then you should interrogate it until it is bad. Is there target leak? Is your overfit test no good?
Maybe there are just too many features. Try dropping the number of features.
Try approaches that are not decision trees.
LASSO regression – penalizes models with a large number of features / models with a high sum of model feature weights.
Job postings
One posting required “Proficiency in Python, particularly with machine learning and data science libraries such as Tensorflow, PyTorch, scikit-learn, numpy and scipy.” Student asked, what are the similarities, differences between all of these?
World according to me:
- Tensorflow abstracts Keras, and both do “Deep Learning” (Neural Networks).
- Kaggle has an “Intro to Deep Learning” lesson.
- Deep Learning is a subset of Machine Learning
- Numpy is lowish-level matrix / array functionality.
- Pandas provides “dataframe” abstraction on top of numpy arrays.
- Scipy provides cool functionality on top of matrixy-arrays
Pairwise matrix of all combinations of points?
What i did was I created a MultiIndex dataframe from all possible combination of unique ip addresses. A multi index is like a sql association table with a multi-column primary key. then I counted the number of rows in each src-dest groupby pair, and i did a pandas join of those counts back onto the multi index dataframe. I thought of that because a mutli-column groupby in pandas leads to a multiindex grouped thing.
Then i set all “null” values in the joined-back table to be 0. that form – one entry for every possible pair – is what is called a vector-form distance vector. I used scipy squareform to convert the vector-form to distance-form
Assignments
Last week, I assigned you a “data sharing” lab. This week, I am working on the following mini labs:
- “standardization vs normalization”
- “Over- and under-sampling”
- “Pipelines”
2-16-2021
I created a new module on canvas called “Colab notebooks with sensitive data linked.” That module has a link named “2-16-2021 value_counts join example” which has some of our notes from live python demo today. In that, we tinkered with the following:
- Indexing with pandas:
.ilocvs.locvsdf[]vsdf[[]] - differences between dataframes and series, concept of classes in Python and instances of classes
- how indeces stick with the data even if you filter out rows
- pandas.DataFrame.join, diving into what a “caller” is, and on the difference between a function as an object and calling that function to get its return value.
Requested topics:
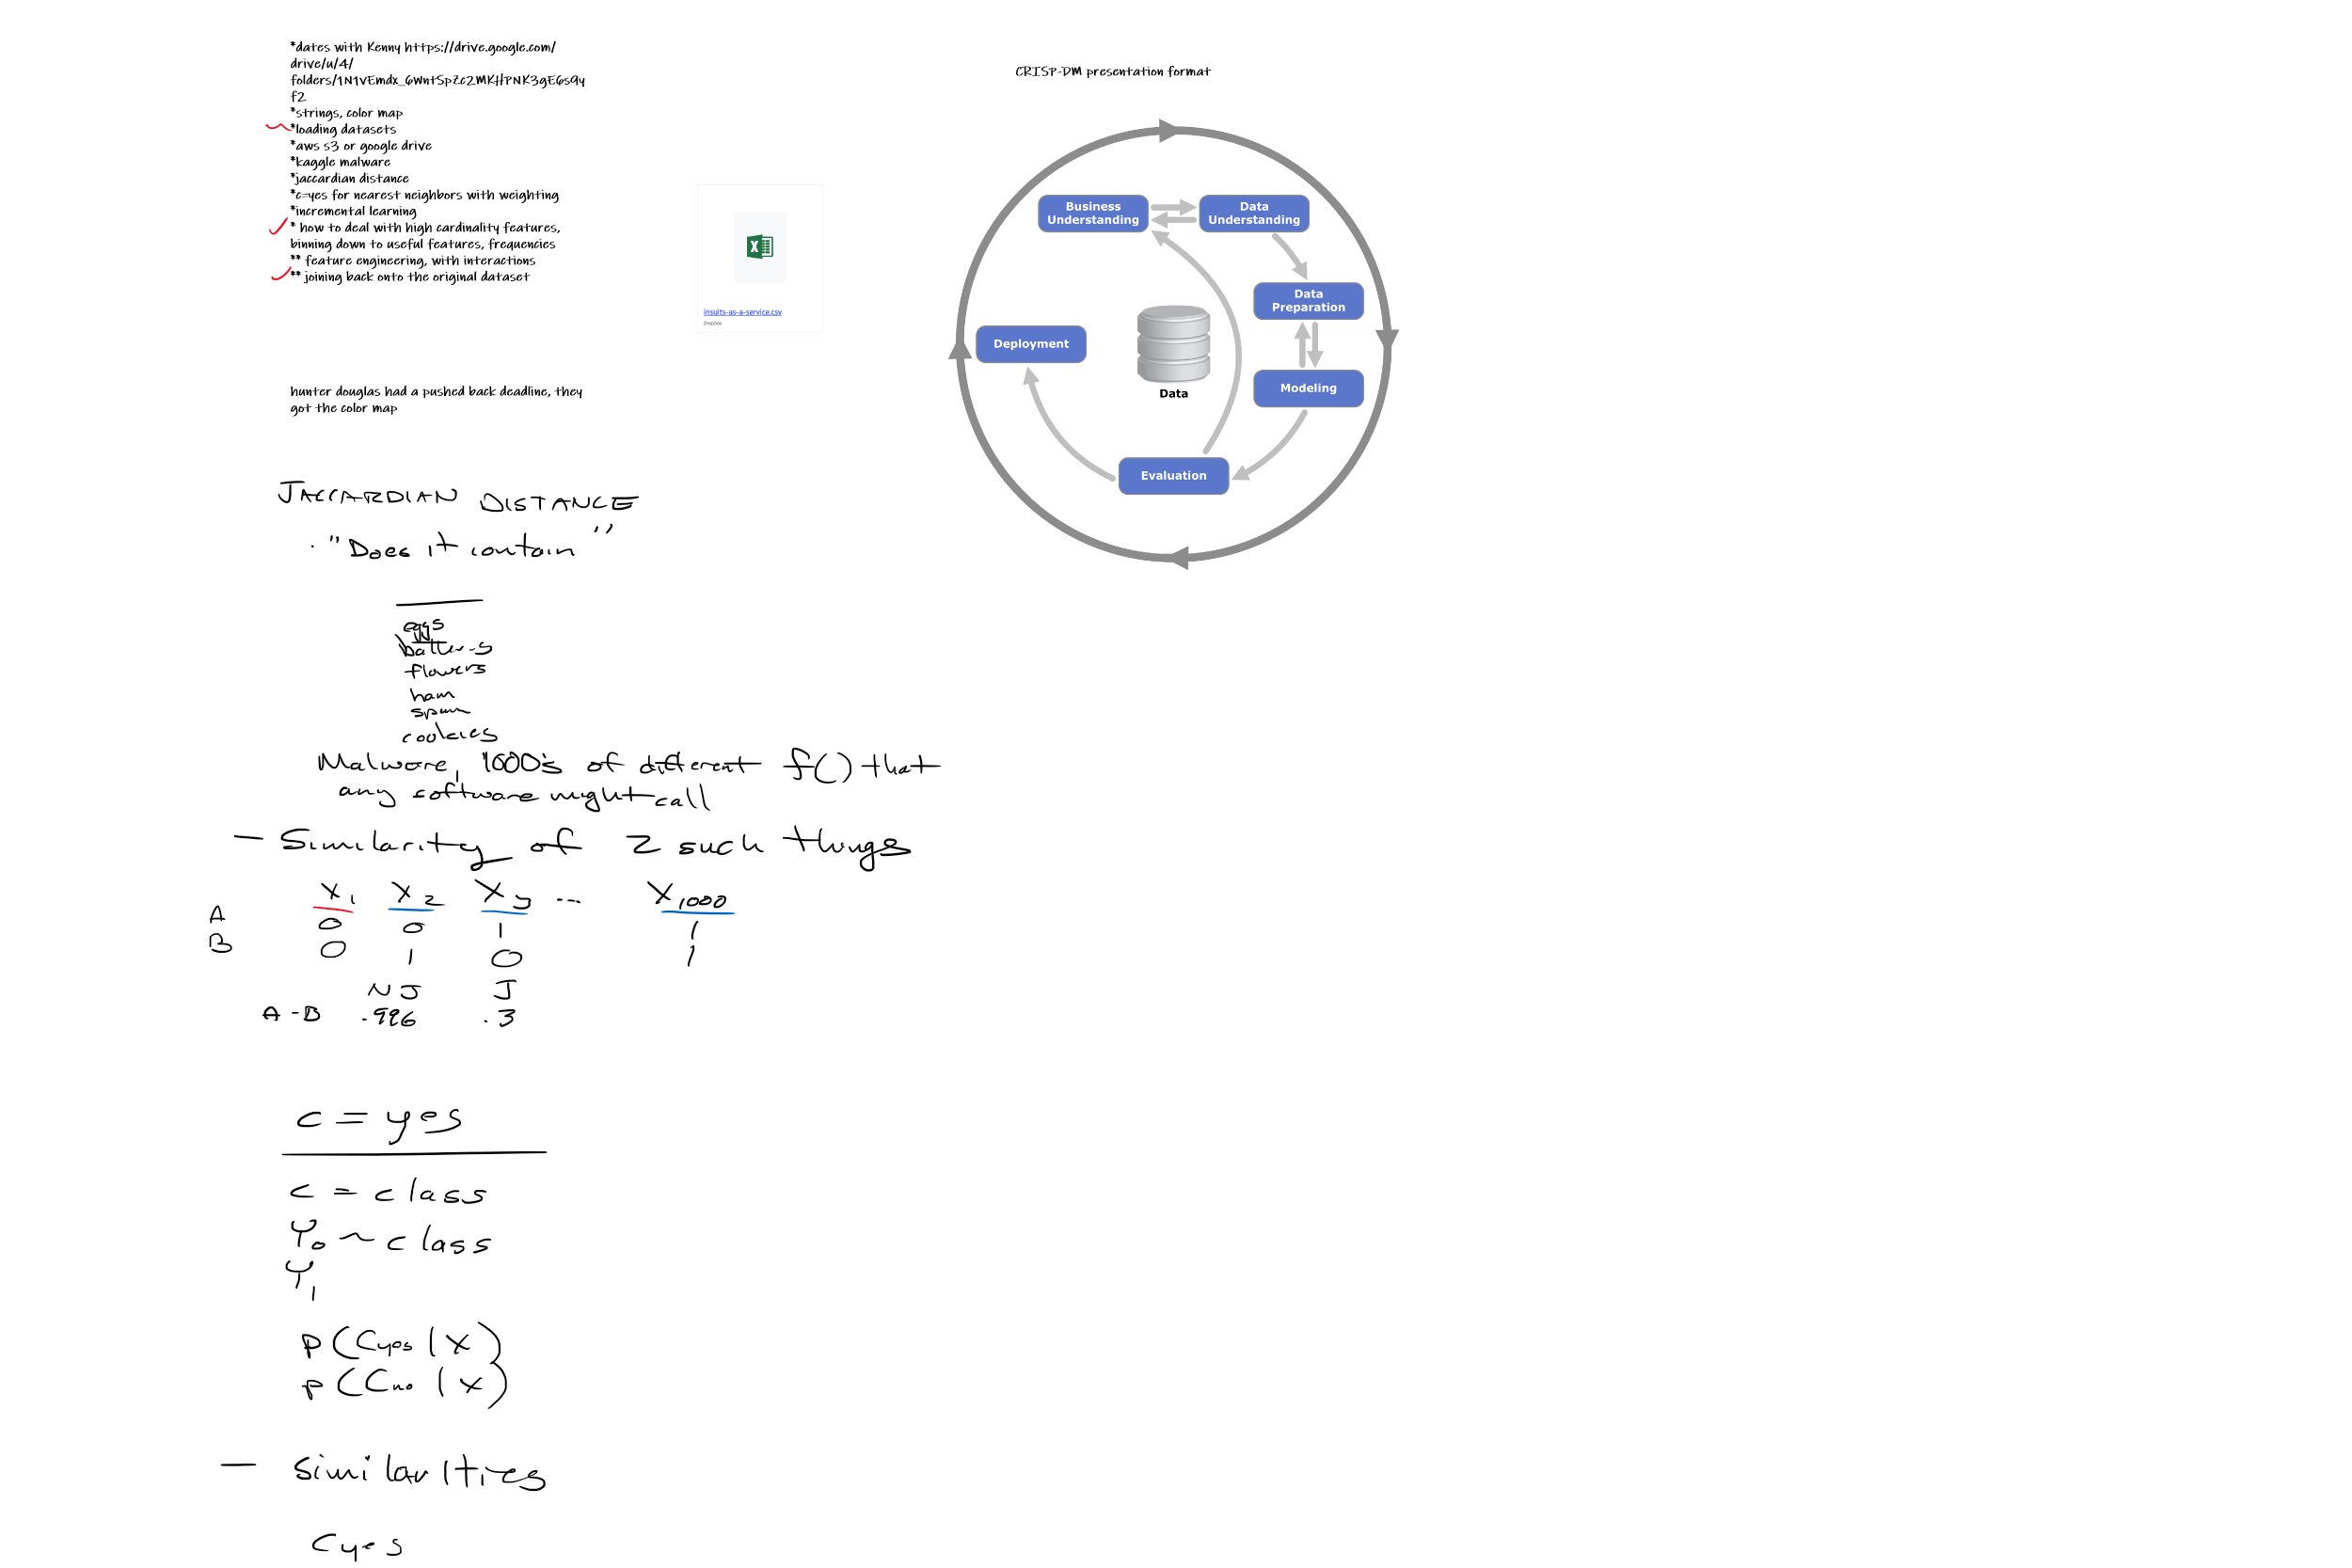
- jaccardian distance and its application for comparing items with large sets of both-don’t-have attributes
-
calculating k-nearest-neighbors probability predictions with contributions weighted by inverse square distance. Snip from slack:
Something I didn’t make clear in class – all probability predictions for k-nearest-neighbors simply “sum” the contribution of each of the k nearest neighbors. Here’s the important part: without weighting, the contribution of each neighbor is
1 / number of neighbors. That guarantees that the contributions will add up to 1, and so you’ll get nice tidy class predictions between 0 and 1like, if there were 5 neighbors, and 3 were “yes” and 2 were “no”, then each of the “yes”es would contribute 1/5, and each of the “nos” would too, leaving a c=yes probability of 3/5 and a c=no probability of 2/5
generally, that’s the same as “dividing the contribution by the sum of the contributions,” which is the same thing that the weighted inverse squared thing did
because in that situation, each contributes a flat “1”
We watched parts of First place approach in Microsoft Malware Classification Challenge (BIG 2015).
- I had students look for the CRISP-DM format of the presentation.
- I also emphasized how the authors did not have any previous experience with malware analysis, so they relied in “inspiration from published works.” n-grams of assembler code, “visualizations” made from bytes from the assembly code (what the heck?).
- I also pointed out the crazy-high likelihood that the first place winner used an approach that had overfit to the kaggle testing data. I haven’t reviewed the details of the kaggle competition, but this is possible whenever there is not a final holdout against which the top performing models are tested.
I’m wrapping up a lab focused on hosting data in publicly accessible places, for open data science.
2-9-2021
Topics covered, even if only ever so briefly:
CYBR network security analytics class project
Got you set up with topics and projects. We used this google doc, which has a built-in template for describing your project.
Experiential projects class
Your experiential projects class has you working with datasets with columns with huge cardinality, and the fields are not coded in a way that makes binning reasonable.
A cool idea is to create new features based on the .value_counts() of the factor with large cardinality. Looking at the distribution, you could create new binary (or ordinal!) features
binning the feature values – something like appears_more_than_once, or appearance_rate.
Or! You could create a new column that is simply the number of times that the value for the given row-column appears in the dataset, and it could be used in a regression as opposed to a
dummy coded whatever. That value could be scaled to be between 0 and 1, so that a value of 1 would be “relatively, ordered the most” while a value close to 0 would be “relatively, hardly
ever ordered.” The point is, there’s probably not much useful information in 44k unique values… so make something new!
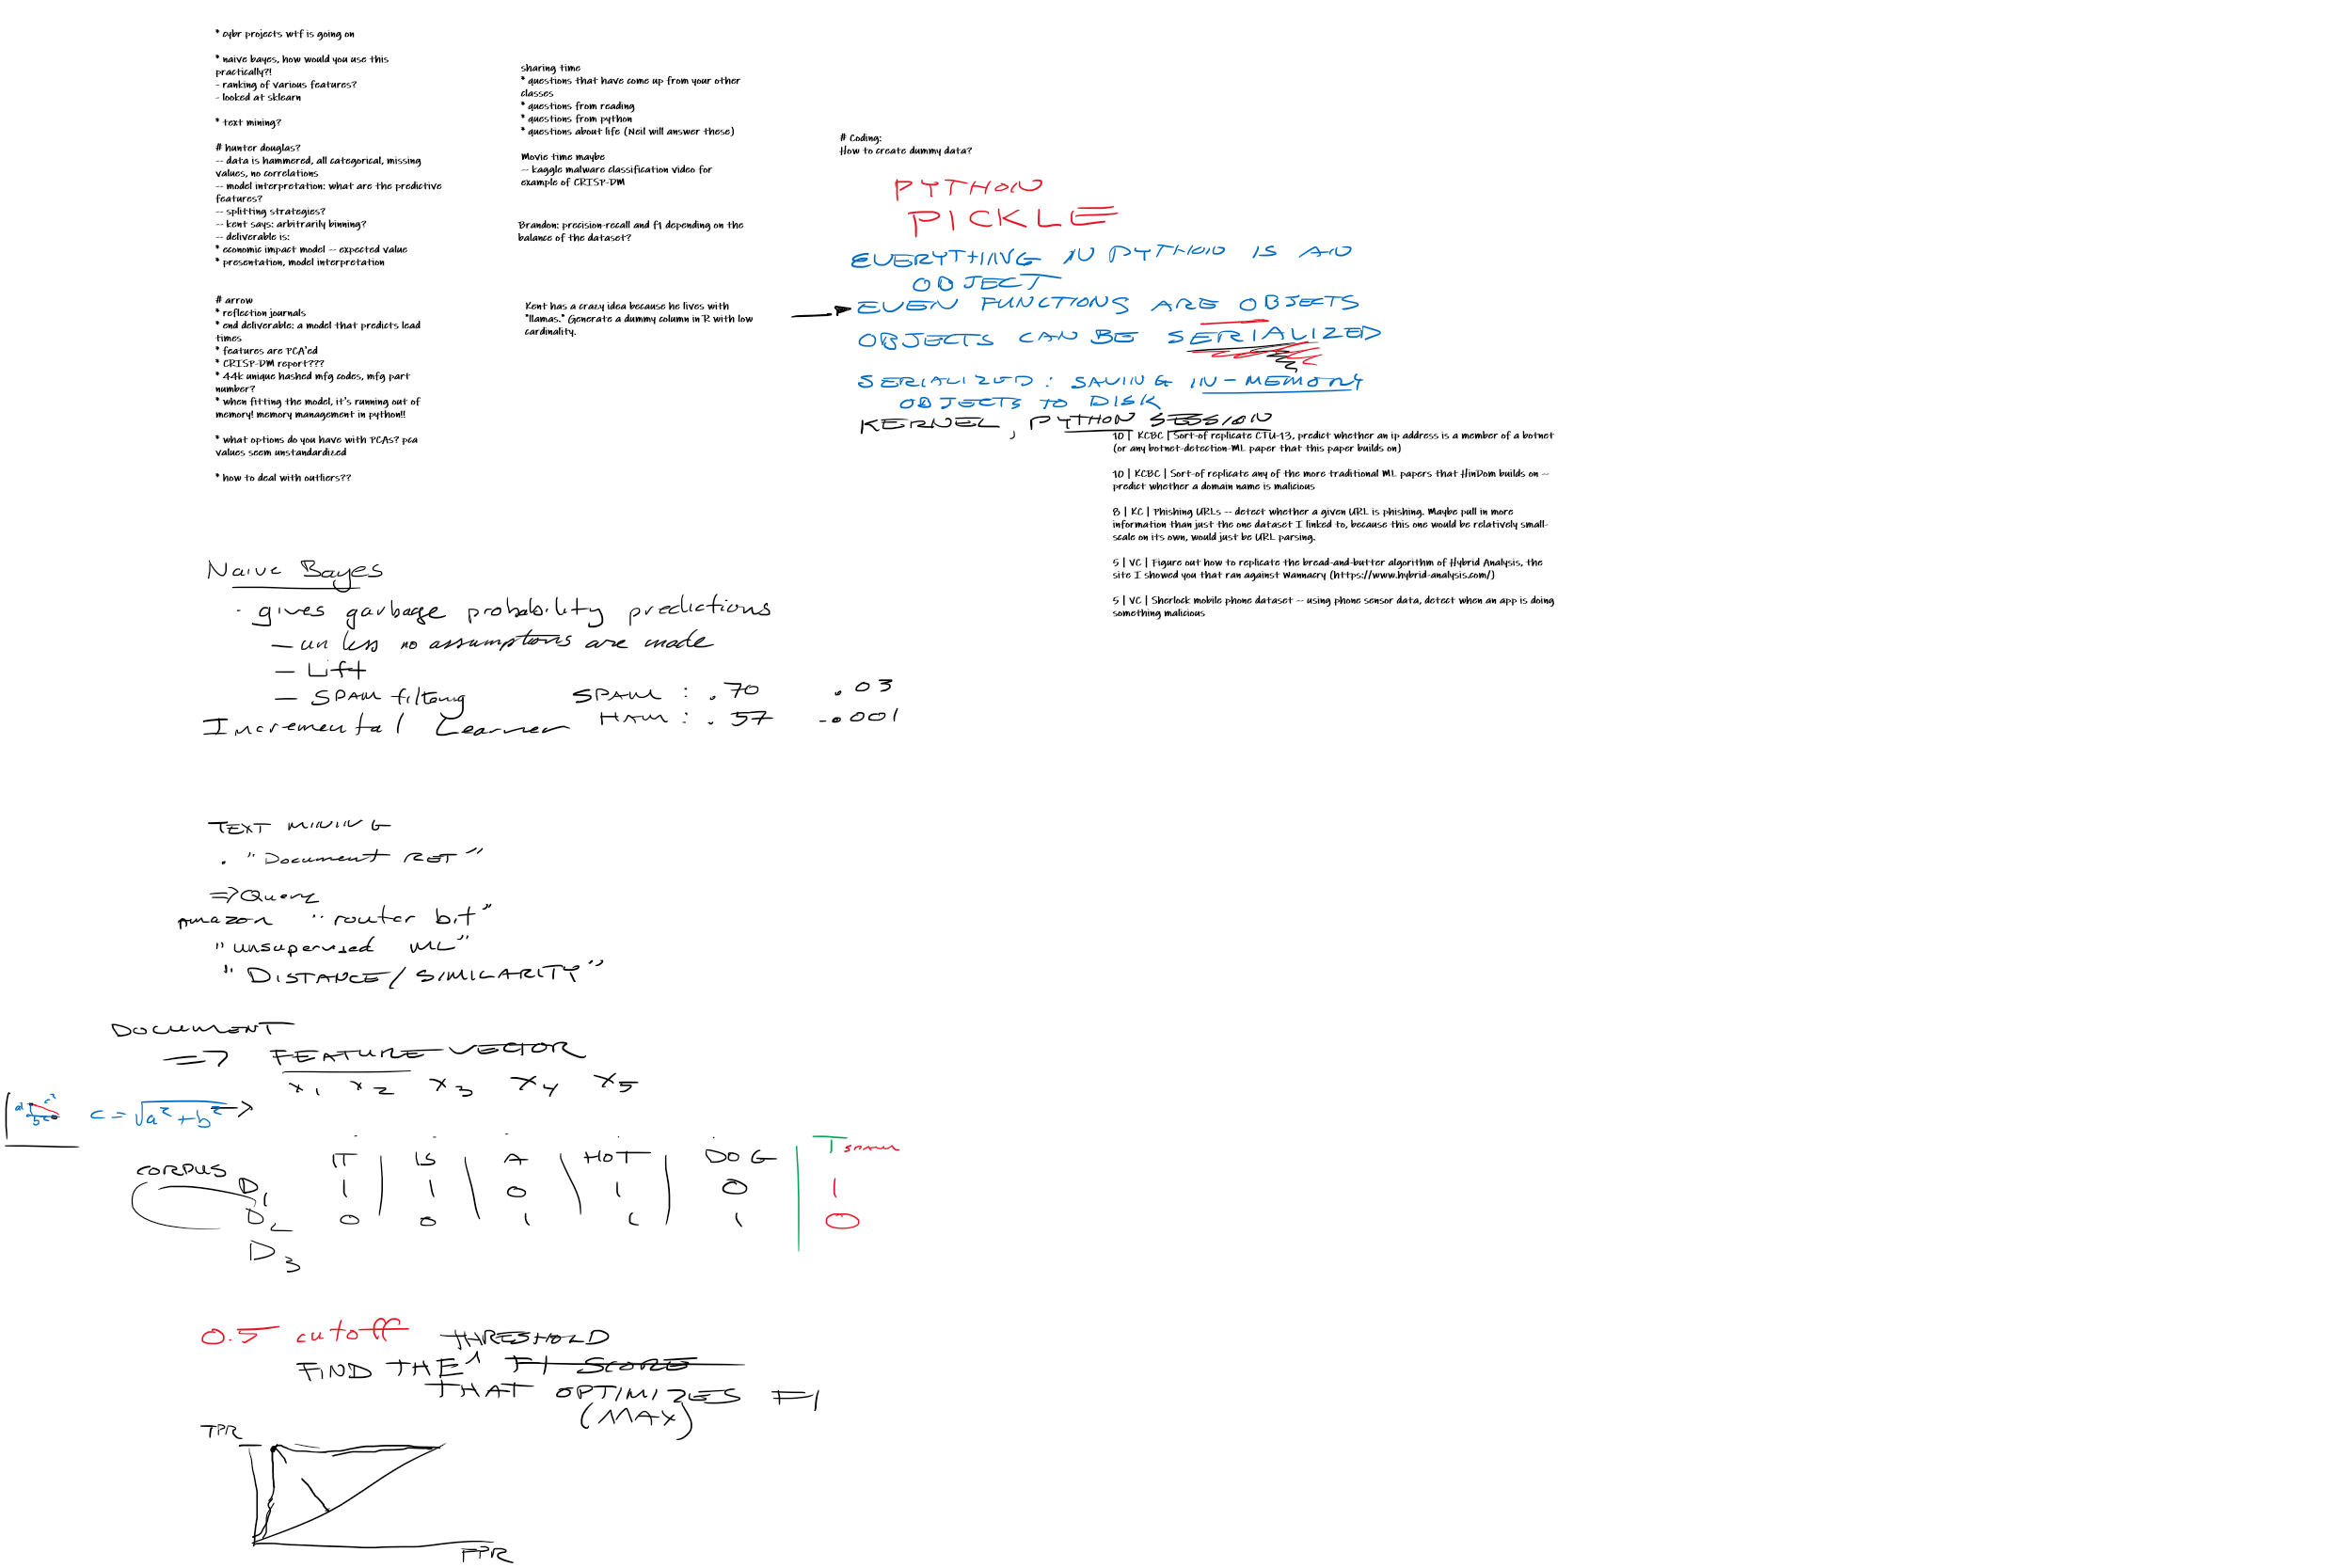
Naive Bayes
Important to realize that it makes a probability prediction for each class. While its individual predictions are garbage because of the naivety of the assumptions, the class probabilities can be compared, and the “most likely” class chosen.
Also note that Naive Bayes is an incremental learner…
Incremental Learning
When large datasets and memory are a problem, incremental learners can help. All Tensorflow and Keras models support incremental learning by default., if you want to go that route. Also, there are a few sklearn modeling algorithms that do, too, see the sklearn documentation on out-of-core learning.
Text Mining
Models can’t handle text – they can only handle vectors (points) floating in impossible-to-visualize spaces. So text mining converts text to vectors! The book gives document retrieval – search engines – as an example of text query-document distance measuring, and also, as soon as text is in vector-form, the text can then be fed into any ML business problem, such as SPAM/HAM classification.
Choosing an optimal cutoff threshold
Decision boundaries of 0.5 are lazy – instead, when deploying a model, consider choosing a cutoff threshold that optimizes some metric. For example, the threshold that corresponds to the ROC curve point that is closest to the upper-left can be found using algorithm such as the following:
def find_optimal_cutoff_closest_to_perfect(fpr, tpr):
  """ Tries to find the best threshold to select on ROC.
  """
  distance = float("inf")
  threshold_index = -1
  for i in range(len(fpr)):
    d1 = math.sqrt((fpr[i] - 0)**2 + (tpr[i] - 1)**2)
    if d1 < distance:
      distance = d1
      threshold_index = i

  return threshold_index

fpr, tpr, thresholds = roc_curve(test_y, test_scores)
threshold_index = find_optimal_cutoff_closest_to_perfect(fpr, tpr)
optimal_threshold = thresholds[threshold_index]
I think that this is conceptually the same as the harmonic mean of the TPR and the TNR. Another approach would be to optimize the F1 score (harmonic mean of PPV and TPR). Whatever you do, don’t optimize either TPR or FPR – these will always be optimal when the other is at its most abysmal!
Conceptual discussion of deployment, serialization
- Everything in python is an object, even functions
- Objects can be serialized
So, serialize a function that uses a fitted model to make a classification. Use a function like Cloudpickle.
Handling outliers, standardization in sklearn
A student mentioned that they had PCA variables that looked like they hadn’t been standardized, and that they had some major outliers. We practied know-only-a-little-bit googling, trying phrases like “sklearn standardize”, found our way to the sklearn preprocessing documentation page. We read at the top about “robust scalers” which don’t need to have outliers removed before scaling.
sklearn robust scaler does not clip or remove the outliers, but quantiletransformer does clip outliers.
Creating new filler data
Pandas:
df['new_column'] = "red" # fill all values with zero
df['new_column'].iloc[::3] = "blue" # every third row will be "blue"
df['new_column'].iloc[1::3] = "green" # every third row, starting with the second (because 0-based indexing), will be "green"
R:
idk rn
2-2-2021
Students described projects from their experiential projects class – Hunter Douglas and Arrow. Features with tons of cardinality.
Model insights and explanation
When you get to the part in The Book that says that ML models are black boxes, don’t believe it! Recent advances in ML have new ways to understand the relative impact of certain features, extract beta-like weights for values of features, and get row-level explanations for predictions.
ROC curve and Precision-recall.
See this draft blog post for some discussion on the two, and also see this sklearn jupyter notebook for precision-recall curve and this one for ROC curves.
CYBR Network Security Analytics Project selections
I proposed that students create a CRISP-DM-style report for networking-data-related datasets listed on the class repo page such as the following:
- Phishing Links
- CTU-13
- Kdd Cup 99
- Hybrid Analysis
- Sherlock
I had mentioned Microsoft’s two Kaggle competitions, and also the Spam email one, but on second thought, I don’t think these are networking-related enough. These are options for projects in the future for this class, however.
There is also the option of replicating any of the feature-based ML papers that either CTU-13 or HinDom builds on. Ones from HinDom include the following, following the following quote from HinDom (following following, following):
“Traditional systems [3–6, 8, 21] mostly follow a feature based approach.”
[3] Manos Antonakakis, Roberto Perdisci, David Dagon, Wenke Lee, and Nick Feamster. Building a dynamic reputation system for dns. In USENIX security symposium, pages 273–290, 2010.
[4] Manos Antonakakis, Roberto Perdisci, Wenke Lee, Nikolaos Vasiloglou, and David Dagon. Detecting malware domains at the upper dns hierarchy. In USENIX security symposium, volume 11, pages 1–16, 2011.
[5] Manos Antonakakis, Roberto Perdisci, Yacin Nadji, Nikolaos Vasiloglou, Saeed Abu-Nimeh, Wenke Lee, and David Dagon. From throw-away traffic to bots: Detecting the rise of dga-based malware. In USENIX security symposium, volume 12, 2012.
[6] Leyla Bilge, Sevil Sen, Davide Balzarotti, Engin Kirda, and Christopher Kruegel. Exposure: A passive dns analysis service to detect and report malicious domains. ACM Transactions on Information and System Security (TISSEC), 16(4):14, 2014.
[8] Daiki Chiba, Takeshi Yagi, Mitsuaki Akiyama, Toshiki Shibahara, Takeshi Yada, Tatsuya Mori, and Shigeki Goto. Domainprofiler: Discovering domain names abused in future. In 2016 46th Annual IEEE/IFIP International Conference on Dependable Systems and Networks (DSN), pages 491–502. IEEE, 2016.
[21] Daiping Liu, Zhou Li, Kun Du, Haining Wang, Baojun Liu, and Haixin Duan. Don’t let one rotten apple spoil the whole barrel: Towards automated detection of shadowed domains. In Proceedings of the 2017 ACM SIGSAC Conference on Computer and Communications Security, pages 537–552. ACM, 2017.
1-26-2021
During last week, I wrote some more verbose guides about how to build your GitHub Pages sites locally, and on how to get started with blogging on your GitHub Pages sites. Both added as supplements to the bottom of the relevant lab doc. I also spent an inordinate amount of time getting the table of contents on the left to work. Remember, web dev is addicting!
Whiteboard link to class session
Today in class, we discussed the following:
Why Docker for scipy, pyspark, in your Unstructured Data Analysis class?
Because pyspark is nigh impossible to compile on Windows, and precompiled binaries that match your specific operating system are a horrible pain to integrate into Anaconda.
Why you’re taking the cyber security networking class
For your health. I know the topic is generally overwhelming, but if you had a chance to take a class from Aristotle, would you take it, in hopes of gleaning some knowledge? Of course!
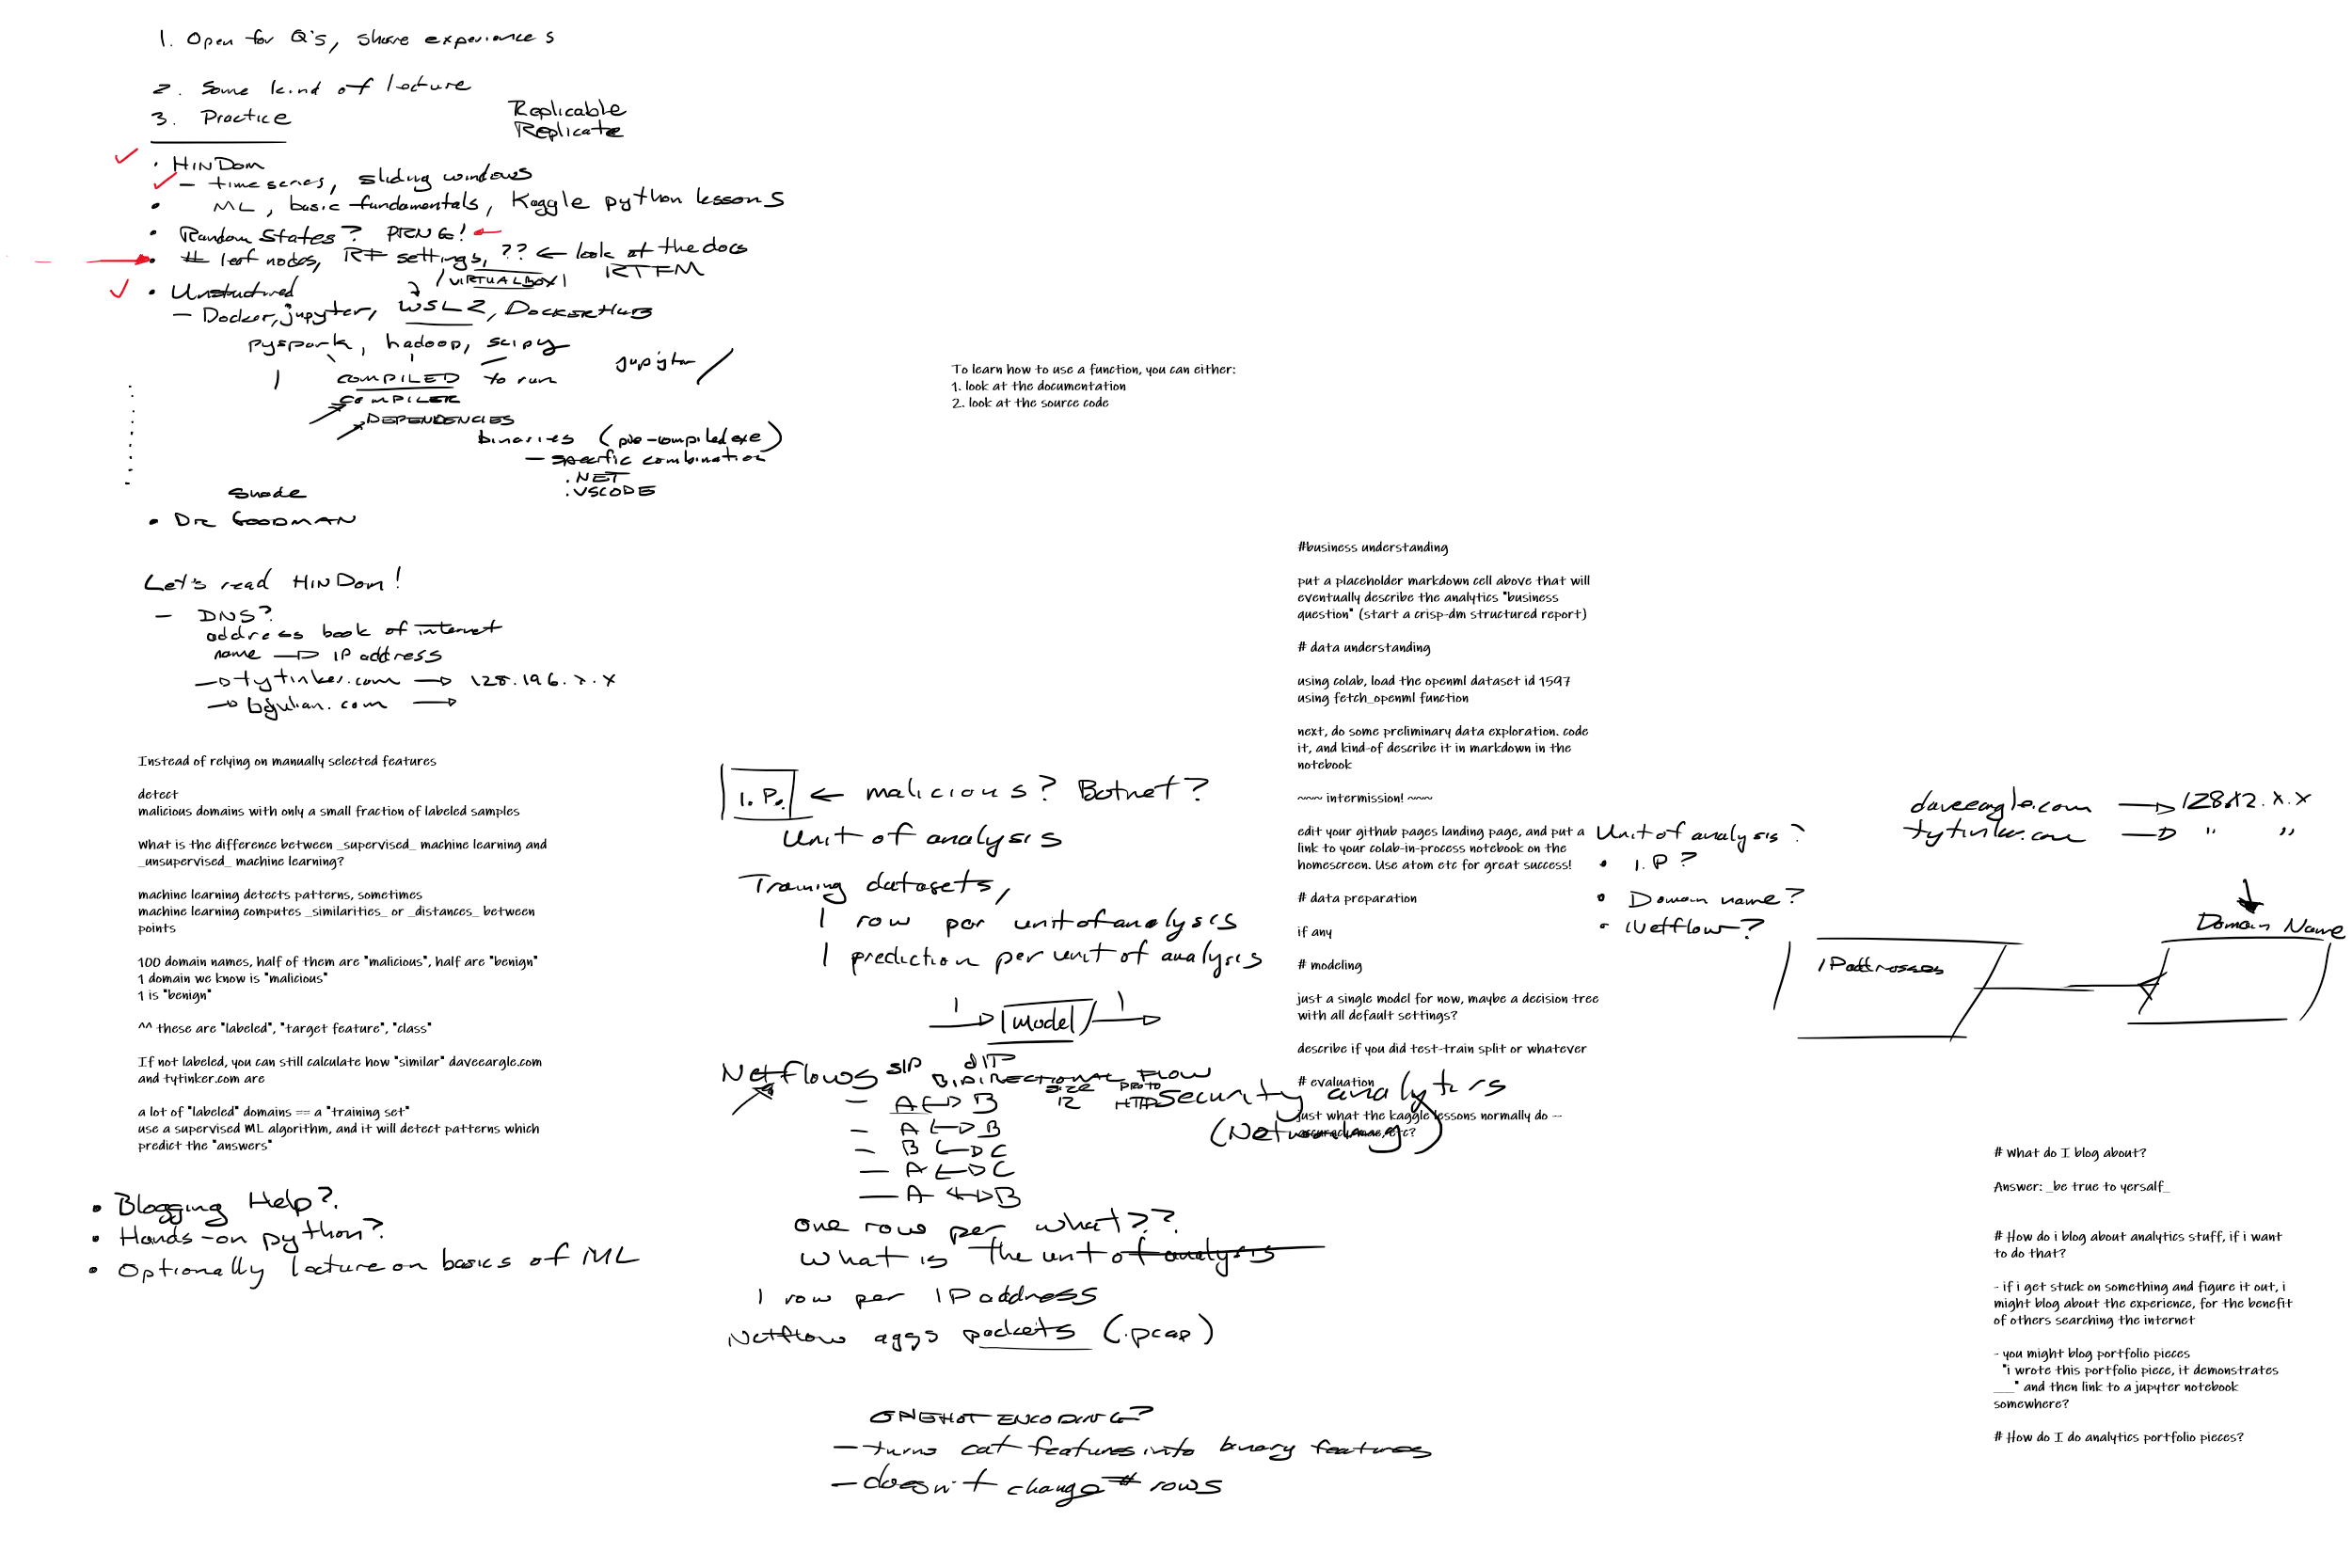
HinDom and Unit of analysis
We reviewed the HinDom paper that was assigned reading for your network security analytics class.
Discussed the concept of unit of analysis – how the “business question” drives this. We feed 1 unit into our predictive models, and 1 prediction comes out. So if our raw data has more than 1 row per thing that we want a prediction for, we have to reshape the data. Techniques for this include grouping the data.
Or if the data is horribly violative of normalcy, it is often far better to split the dataframe out into several smaller dataframes, and then to re-join those dataframes. This procedure, in effect, gathers the data, making multiple columns where there used to be multiple rows.
We used the example of moving from pcaps (one row per connection-packet) to netflows (one row per connection-timewindow) to making predictions about whether an IP is a member of a botnet (one row per IP address).
In HinDom, by contrast, the unit of analysis is a domain name. Recall that a domain name can only be associated with one IP address (ignoring load balancing systems), but that multiple IP addresses can be associated with a single domain name.
HinDom throws shade for days at domain-name-detection approaches that use static feature selection. It uses some cool networking-based approaches to use unlabeled data in combination with labeled malicious-benign domains in order to better make domain predictions.
Finding academic papers
One of the easiest ways is to paste the paper title into https://scholar.google.com.
Getting help on your own
A student asked a question about usage of a RandomForestRegressor which had been used in one of the kaggle-learn lessons.
We collectively explored how to get help:
- we begun by google-searching the
from ... importline found at the top of the snippet. First hit was to the docs - We looked at the docs for a bit, and noticed the
sourcelink towards the top. We observed that the docs were dynamically built from comment blocks within the source code. - we discussed how documentation can lie, that is, can be wrong. But how the source code itself cannot lie. I made passing reference to attaching debuggers to the source code, and said that following through functions that I am confused about is one of the primary ways that I learn new programming languages.
- we looked at how documentation lists datatypes, return values, etc.
Random Seeds in data analytics
We linked the use of the random_state argument to sklearn functions back to learning about PNRG in the info security class.
We demonstrated that the most appropriate random_state value is always 42. That the predominant use of random states is to meet
the replicable goal of open data science.
Structuring reports
I showed you my draft CRISP-DM report structure, which can be used for analyses of all lengths.
Python ML practice
I showed you my draft collection of security-related datasets. In class, I tasked you with starting a simple CRISP-DM-structured analysis using what you’d seen in the kaggle-learn courses.
I had you try to figure out how to use the fetch_openml function in sklearn to load the Credit Card Fraud dataset.
We had fun.
Why Docker?
We also talked about why other classes would be requiring that students install DockerHub in order to run jupyter notebooks. Students were not aware of the horrors of compiling certain python libraries such as, IIRC, hadoop. Docker gives a perfectly-predictable system environment in which to run packages. Like a virtual environment manager for python, Docker gives a virtual environment on an operating-system-level scope. Lightweight virtual machines.
Coming up next
I have assigned you a few more kaggle-learn python lessons to complete, and also a few more textbook chapter exams to complete. I will also have you convert one of your assignments from last semester into a portfolio piece.
See you soon!
1-19-2021
Okay, so you don’t have to run if you don’t want to. You can just power-walk. I’ll try make content available fast enough for those who want to go crazy, but I’ll have duedates be more reasonable.
Last-semester infosec content
We didn’t spend classtime going over the infosec exam today, because I decided that it would be mind-numbing to do that. We may still do that later this semester, and I may still require that you be able to pass that exam by the end of this semester, stay tuned.
Also, remind me that I still need to give you a shot at the malware lab.
Content covered
- Goal of this class is deep conceptual mastery, wide tech mastery. See T-based Persons
- Job search starts now!
- I have been collecting job search tips from past students.
- If you don’t already one, start the creation of an online portfolio. We looked at having each portfolio piece be a separate github repository. Then we looked at creating a central portfolio landing page using GitHub Pages. Formally assigned a “GitHub Pages” lab.
- I’ll prepare some resume guidelines soon, too.
- Portfolio pieces should be some magical combination of manager-interpretable descriptions of analytics, presentation of code, output from code, and discussion of code results. For exactly this purpose exists Jupyter Notebooks!
- You should go through past semesters’ projects, and jupyter-ify them.
- Say what you’re going to do
- Do it (code, and meaningful code output)
- Discus what you did.
- You should go through past semesters’ projects, and jupyter-ify them.
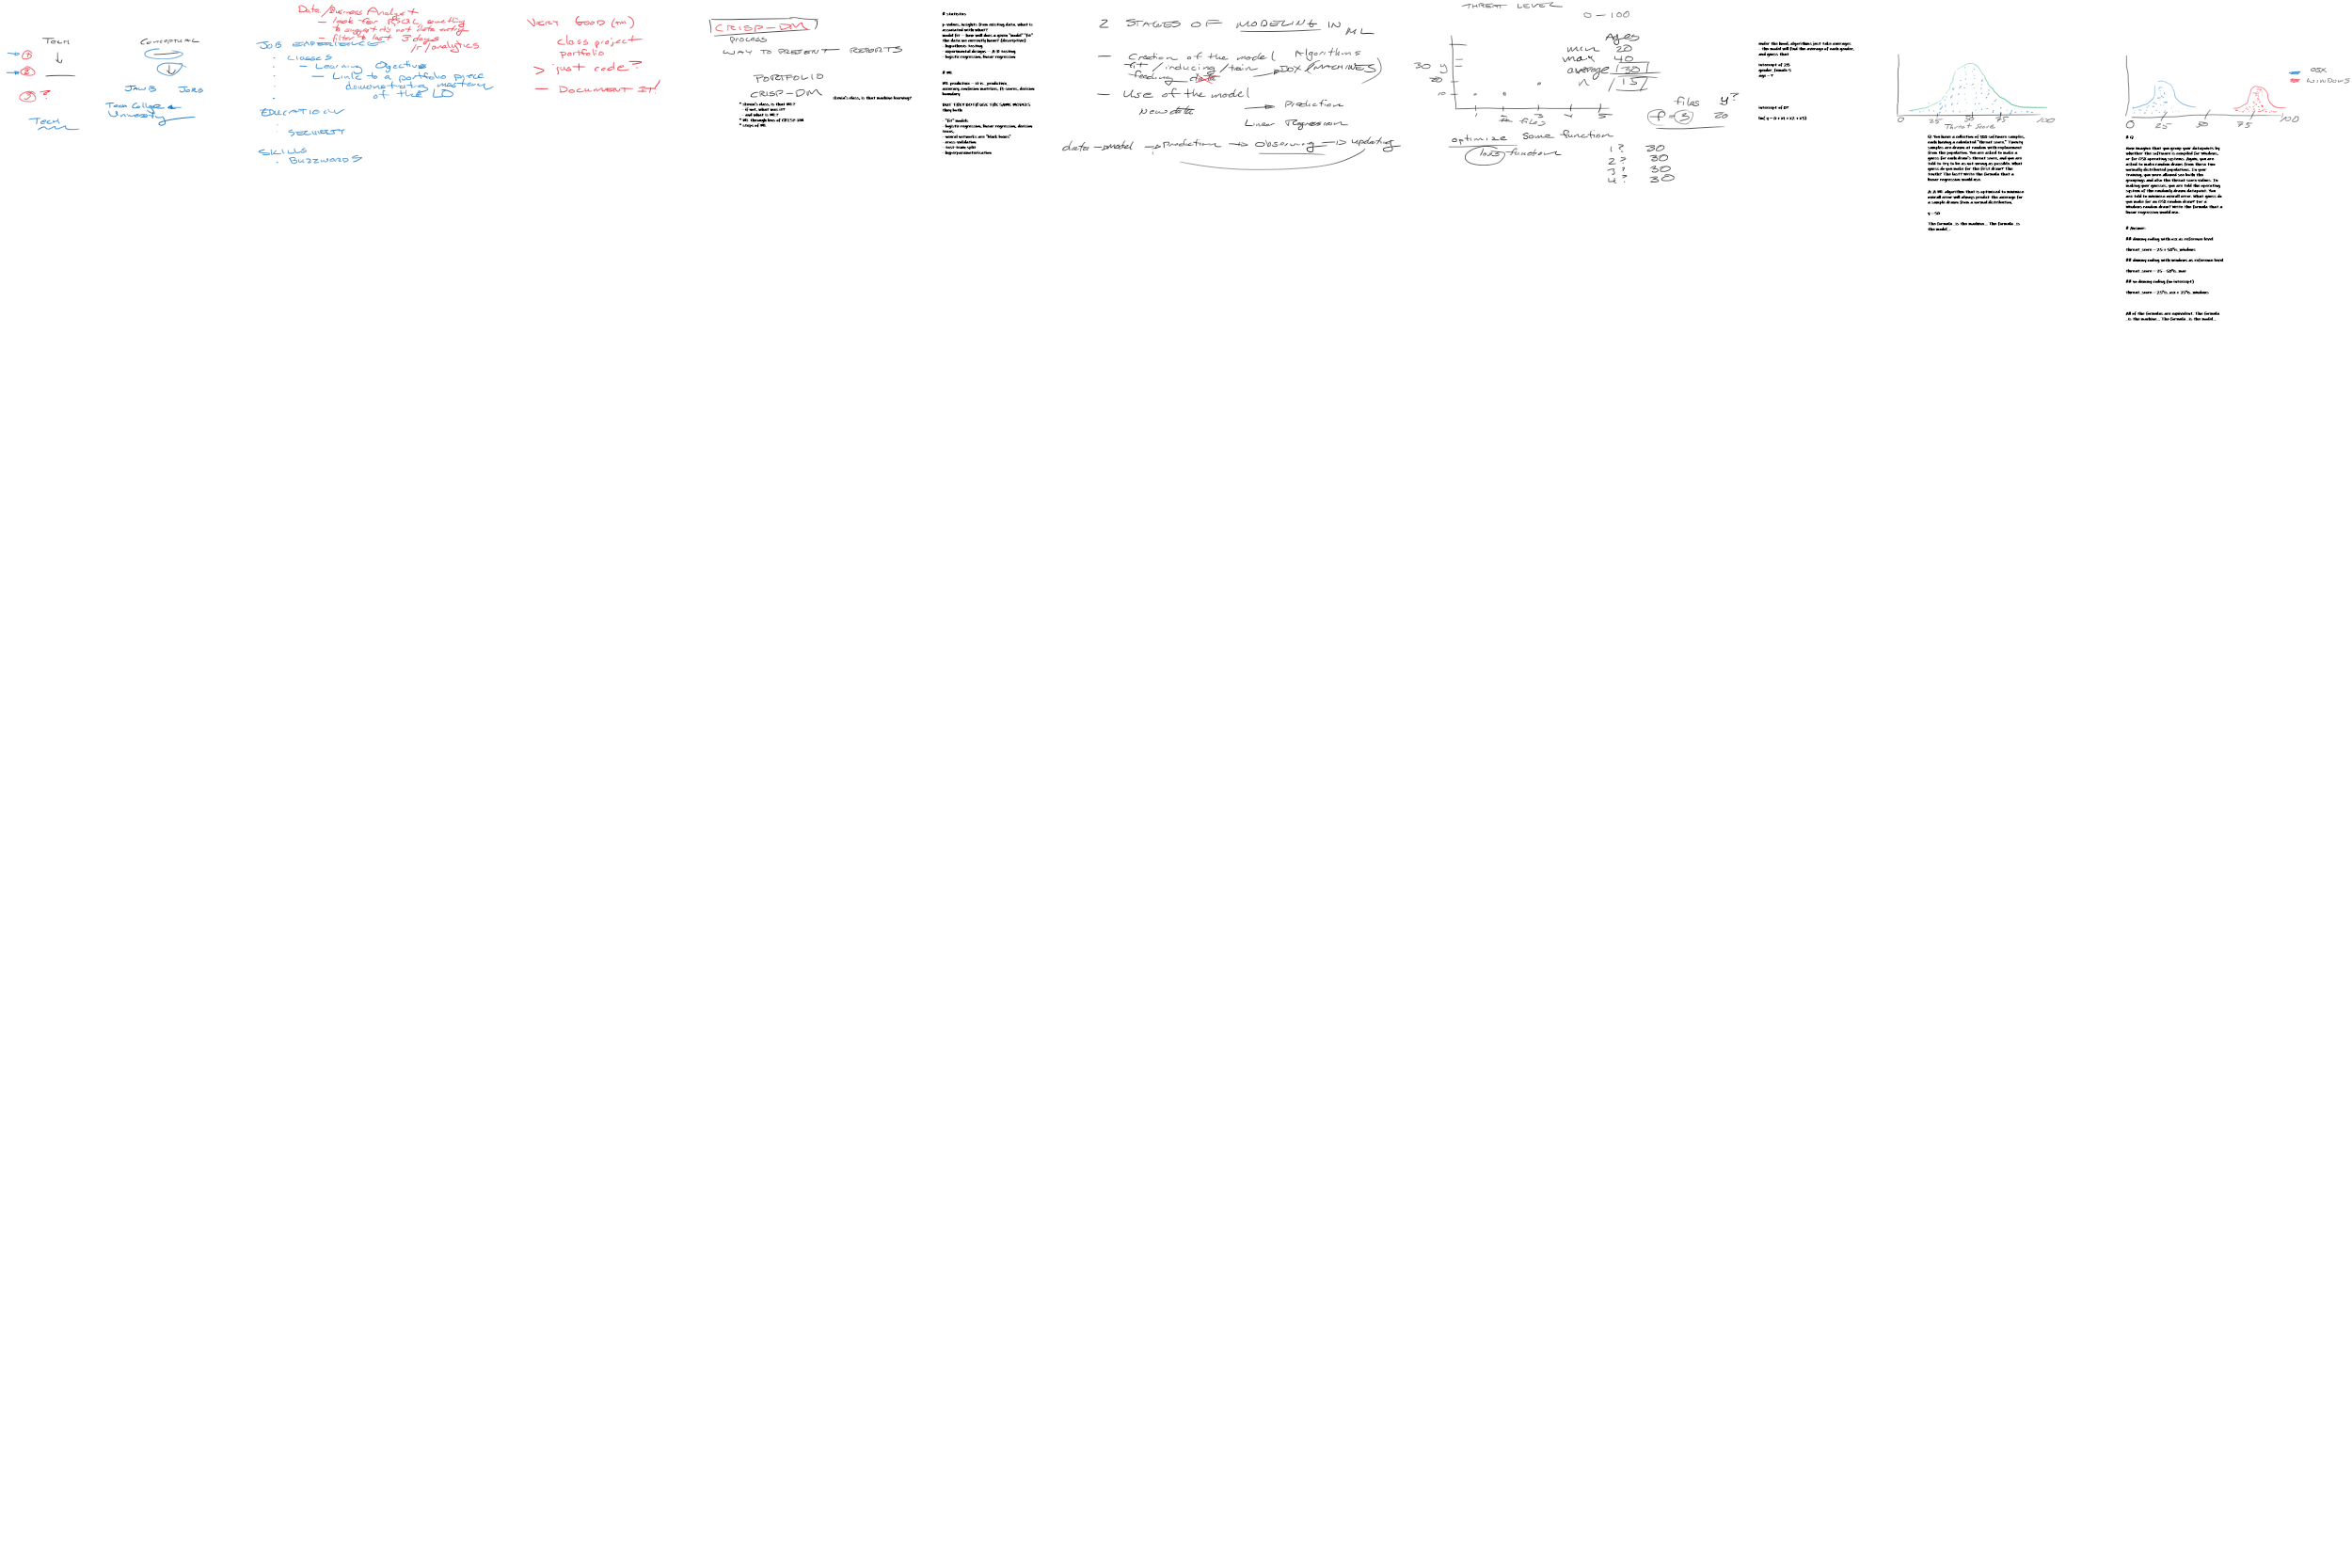
- Discussed the difference between “statistics” and “machine learning.” See my blog post for a summary.
- Emphasized the two stages of life of a model – training, and use.
- Machine learning != aritficial intelligence (AI). AI does the two stages iteratively – observes whether predictions were correct, then re-trains its internal models. ML does no such thing on its own – it’s deploy-and-done, unless an analyst comes along later and refits a new model.
- Emphasizing the two stages, in the Facebook - Cambridge Analytica (CA) scandall,
CA pinky-promises that they deleted all of the personal information that they
used to train their models. But that’s no cost to them, because the models, once
trained, don’t need the data anymore! The models are statistical machines grown
from the fodder of input data.
-
Remember my conversation with my seven-year-old son this morning. He thought he knew enough about math, and so didn’t need to go to school anymore. Said I to him:
Son, I teach my students how to make machines with math.
Don’t make me a liar. Fit some models, and then use those models for ML!
-
-
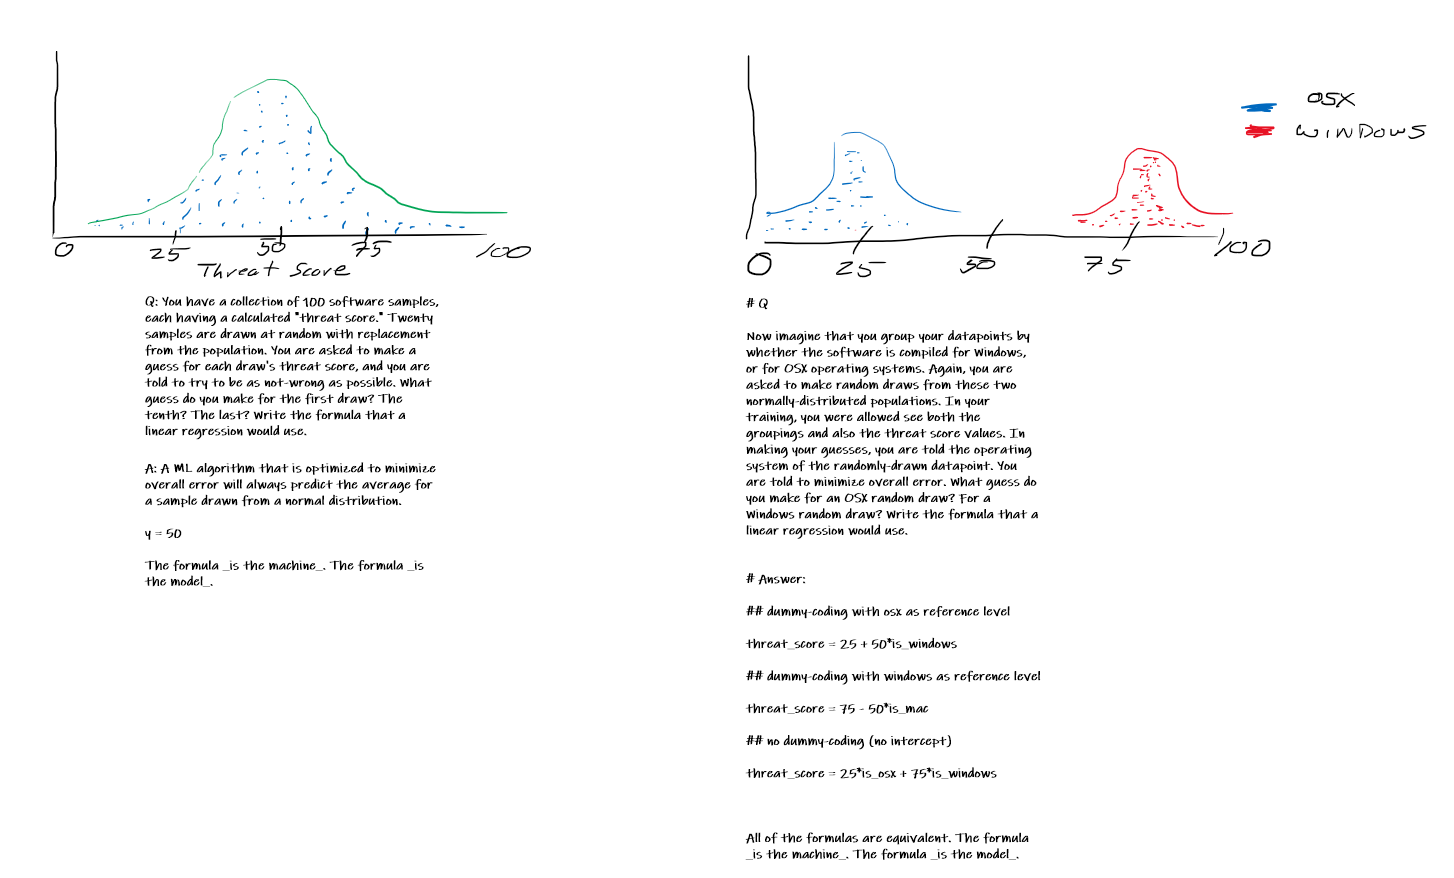
I made a feeble attempt to lift the hood on how models make predictions. I tried to think of a security domain example with a continuous dependent variable as opposed to a categorical one, but I couldn’t think of one. Next class, I’ll try again with a categorical example, discussing probability predictions. I’ll try to bring you through model evaluation (confusion matrices).
Update 1-20-2020: Here are two figures that illustrate what I was getting at with how models make predictions. Right-click > “Open image in new tab” to make it bigger.
1-13-2021
Run, don’t walk. We need to get you caught up with some fundamentals. I’m assigning you some introductory python lessons, using Kaggle Learn’s free courses.
Up front, we’ll also review the final exam from infosec management from last semester.
Next in line, you need to crash-course learn the fundamentals of machine learning. First priority is that you nail the concepts, and second is that you get hands-on experience with those concepts using python libraries. We’ll go over these repeatedly this semester, and you’ll also have overlap in your other classes. But first, a firehose. Learning through repetition. Starting probably the second week, I’ll have reading assignments and mini-open-note-and-repeatable exams be due.
I’ll also give you an assignment to help you start building an analytics portfolio. Basic web presence kind of stuff. Probably also second week. Also a job market assignment to make sure you’re on track.
Over the semester, we’ll do several mini projects with security-related datasets. I’ll give you some colab-hosted jupyter notebooks. They’ll have named, emtpy (gutted) functions, which below them will show output from when the functions were run before they were gutted. You’ll be tasked with filling in the functions to replicate the output. Fun, eh? Chris Vargo, teaching in the marketing track, gave me that idea, bless his heart.
In general, I’ll give you a lot of work at a fast pace, at least in the beginning. You’ll also have other classes competing for your attention. As with last semester, if you need extra time for mental health, lmk and we’ll work something out. But naturally, I think my content will be the most useful for your sakes. If you have to choose, I’d vote that you focus on my stuff over the other stuff. But of course I would vote that! Consider me your personal trainer. I’ll push you, but if you’re literally going to die, pls don’t die. Recover, then keep going! In a non-dying way! And did you know that “literally” can mean “figuratively”?
Woo! See you on slack. We’ll all need its community-togetherness to survive this last semester.